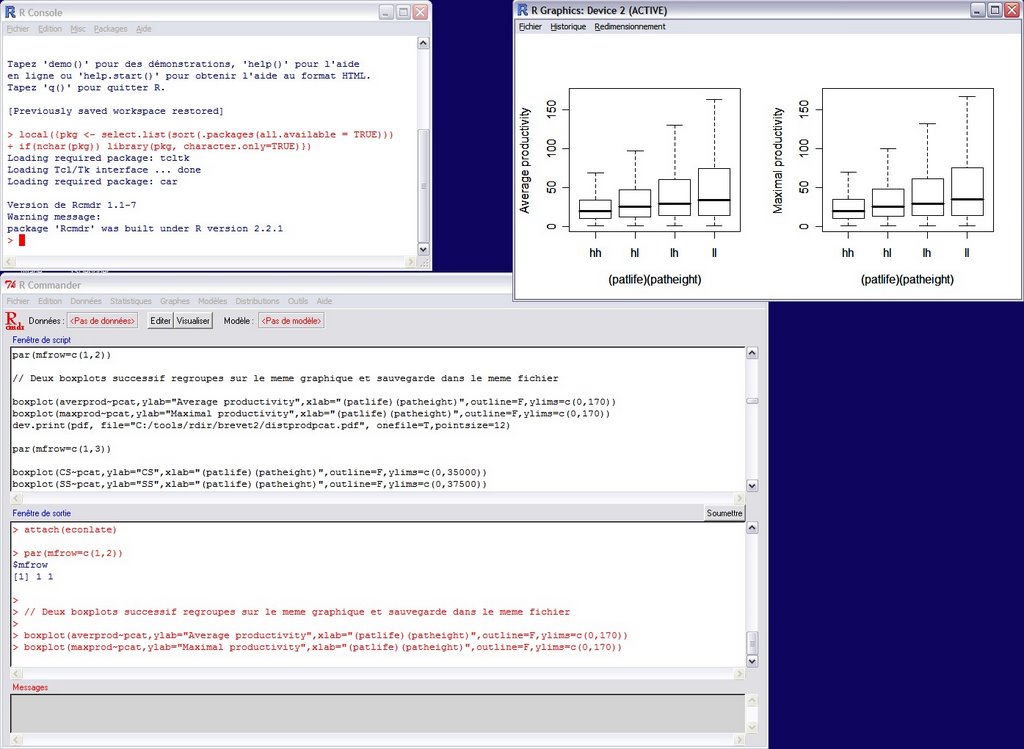
R is the statistical open source software that I use for analyzing the results of my economic simulations and other statistical data. R is a very powerful tool developed by a considerable and very active community. It is not really very user-friendly when you use it out of the box, through the command line, but some of the included packages try to make easier your life (like the RCommander package that is visible on the screenshot above). Other visual user interface projects are also in development. For example, Sciviews already proposes two nice tools: a very flexible and powerful script editor Tinn--R and a graphical gui that replaces the standard Rgui, Sciviews-R. The latter enriches the standard Rgui with some widgets that give an easy access to obkects in memory, for example, and a more flexible editor (but it is also possible to use Tinn-R in combination with this GUI).
The main website of R is the www.r-project.org. You can also download R, other packages and tools from a CRAN repository close to you (check the list of the mirror sites here).
From the website of R:
R is a language and environment for statistical computing and graphics. It is a GNU project which is similar to the S language and environment which was developed at Bell Laboratories (formerly AT&T, now Lucent Technologies) by John Chambers and colleagues. R can be considered as a different implementation of S. There are some important differences, but much code written for S runs unaltered under R.
R provides a wide variety of statistical (linear and nonlinear modelling, classical statistical tests, time-series analysis, classification, clustering, ...) and graphical techniques, and is highly extensible. The S language is often the vehicle of choice for research in statistical methodology, and R provides an Open Source route to participation in that activity.
One of R's strengths is the ease with which well-designed publication-quality plots can be produced, including mathematical symbols and formulae where needed. Great care has been taken over the defaults for the minor design choices in graphics, but the user retains full control.
I really invite you to download R and begin to play with it. You can find very useful tutorials on R on the website, in the Contributed documentation page. Check, for example, “Using R for Data Analysis and Graphics - Introduction, Examples and Commentary” by John Maindonald. You can download the PDF file from this link.
No comments:
Post a Comment