If you write in English (this is probably the case if you are reading this page :-) ), you can definitely learn something from The Elements of Style. This small text by William Strunk, Jr. corrects many potential errors we can make when we write in English, especially if we are not native speakers (even if the book is not originally dedicated to foreign writers). But some adverse opinion also exists about this book.
Another very interesting small book about style is Simple & Direct by Jacques Barzun (published by Quill). Again, this book incites you to clarify your ideas in order to craft sentences with a clear meaning.
More on the grammar side, I would also recommend Practical English Usage by Michael Swan (Oxford University Press). It is really very easy to use thanks to a very intelligent organization. A small excerpt from the table of contents:
173 - each
174- each and every175 - each other and one another
...
If you mainly write scientific articles, you could benefit from Successful Scientific Writing by Matthews, Bowen and Mathews (Cambridge University Press). This book is dedicated to biological and medical sciences but the tips it contains can help for articles in any discipline (I am an economist and I have learned a lot of tricks from it, even if my writing remains quite awful in English :-)).
And if your mother tongue is French, just a single major tip: forget the passive voice, it terribly blurs the significance of sentences in English. Passive voice also gives rise to terribly cumbersome sentences very prone to errors...
And, if English is your third language (as in my case), I wish you good luck ;-)
Other interesting pages:
Sunday, May 07, 2006
Sunday, April 09, 2006
Open source statistical analysis plateform: R-project
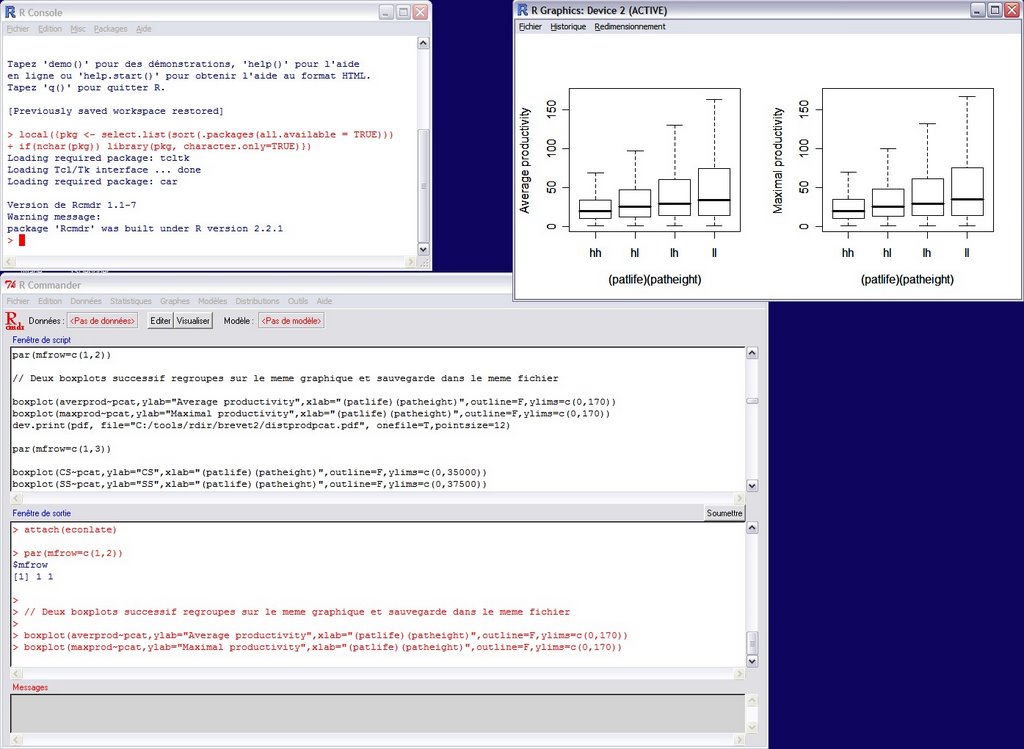
R is the statistical open source software that I use for analyzing the results of my economic simulations and other statistical data. R is a very powerful tool developed by a considerable and very active community. It is not really very user-friendly when you use it out of the box, through the command line, but some of the included packages try to make easier your life (like the RCommander package that is visible on the screenshot above). Other visual user interface projects are also in development. For example, Sciviews already proposes two nice tools: a very flexible and powerful script editor Tinn--R and a graphical gui that replaces the standard Rgui, Sciviews-R. The latter enriches the standard Rgui with some widgets that give an easy access to obkects in memory, for example, and a more flexible editor (but it is also possible to use Tinn-R in combination with this GUI).
The main website of R is the www.r-project.org. You can also download R, other packages and tools from a CRAN repository close to you (check the list of the mirror sites here).
From the website of R:
R is a language and environment for statistical computing and graphics. It is a GNU project which is similar to the S language and environment which was developed at Bell Laboratories (formerly AT&T, now Lucent Technologies) by John Chambers and colleagues. R can be considered as a different implementation of S. There are some important differences, but much code written for S runs unaltered under R.
R provides a wide variety of statistical (linear and nonlinear modelling, classical statistical tests, time-series analysis, classification, clustering, ...) and graphical techniques, and is highly extensible. The S language is often the vehicle of choice for research in statistical methodology, and R provides an Open Source route to participation in that activity.
One of R's strengths is the ease with which well-designed publication-quality plots can be produced, including mathematical symbols and formulae where needed. Great care has been taken over the defaults for the minor design choices in graphics, but the user retains full control.
I really invite you to download R and begin to play with it. You can find very useful tutorials on R on the website, in the Contributed documentation page. Check, for example, “Using R for Data Analysis and Graphics - Introduction, Examples and Commentary” by John Maindonald. You can download the PDF file from this link.
Thursday, April 06, 2006
Editing LaTeX files under Windows: Scientific WorkPlace

This one is not a freeware or open source (it is even quite expensive - especially in France) :-( but I find that SWP is the most powerful, compatible and user-friendly LaTeX editor that we actually have. There are other open source competitors like the very beautiful TeXMacs or Lyx , but he first is not as compatible as SWP and the second is not yet as flexible as SWP, especially concerning the editing of mathematical expressions. Another nice open source but not at all WYSWYG editor is TeXnicCenter.
SWP can save your files in a compatible format that is called "portable latex" and you can easily compile your files using a standard LaTeX motor (I, for example, use Miktex instead of the specific compiler that comes with SWP: TrueTex).
Mackichan provides two versions of this editor: Scientific Word (the editor only) and Scientific Workplace. The workplace version is more expensive because it comes with a algebraic computation system: Mupad. If you have an official version of Maple, you can also use the kernel provided by the latter (I find it more powerful by the way). In fact I do not possess a complete copy of Maple but I have conserved the last kernel that I have had with an old version of SWP (SWP was used to come with Maple) and I configure SWP for this kernel and this sea tup perfectly works. As consequence, I can do computations or plot expressions directly from SWP.
Sunday, April 02, 2006
Drawing figures for LaTeX - jpicEdt - Java Picture editor

jPicEdt is a very user-friendly open source software for creating and editing your drawings for LaTeX documents. Its main strength is, in my opinion, its capacity to generate drawings based on the very nice package PSTRICKS. This is gives a very powerful environment for creating sophisticated drawings.
From the web site (www.jpicedt.org):
jPicEdt can generate LaTeX, eepic and PsTricks code from a user-friendly graphical interface! This may include:
* Every graphical element allowed by the picture environment commands: lines, arrows, circles, boxes.
* Emulated elements, for example lines of any slope (which LaTeX doesn't support natively), circles of any size, ellipses, arcs and polygons. This makes a strong use of the \multiput command.
* Nearly every object allowed by the epic/eepic packages (excluding grids and textured filling): dashed lines, filled (whitened, blackened or shaded) ellipses or polygons, arcs,... Using this package is optional.
* As of version 1.3.2, nearly every object allowed by the pstricks.sty package (this include : filling with colours, hatches, textures, setting various stroke parameters...). Support for pstnode.sty and other related packages is underway.
jPicEdt can parse LaTeX files that include a \begin{picture}...\end{picture} (or \begin{pspicture}...\end{pspicture}) block, and is able to interpret a great deal of commands, either LaTeX-, PsTricks- or eepic-compliant (this allows in particular to load files generated by GnuPlot with a gset term eepic command).
jPicEdt is written in JAVA. As a result, it can run on any platform where a JVM (Java Virtual Machine) is installed (nearly every Unix flavors, plus Window 9x/2000/XP and MacOS, at least...)
If you configure jpicEdt for compiling the drawings with LaTeX and dvips, you can very easily convert them to PDF for also using them with PDFLaTeX.
Friday, March 31, 2006
Drawing figures for Latex - Ipe extensible drawing editor
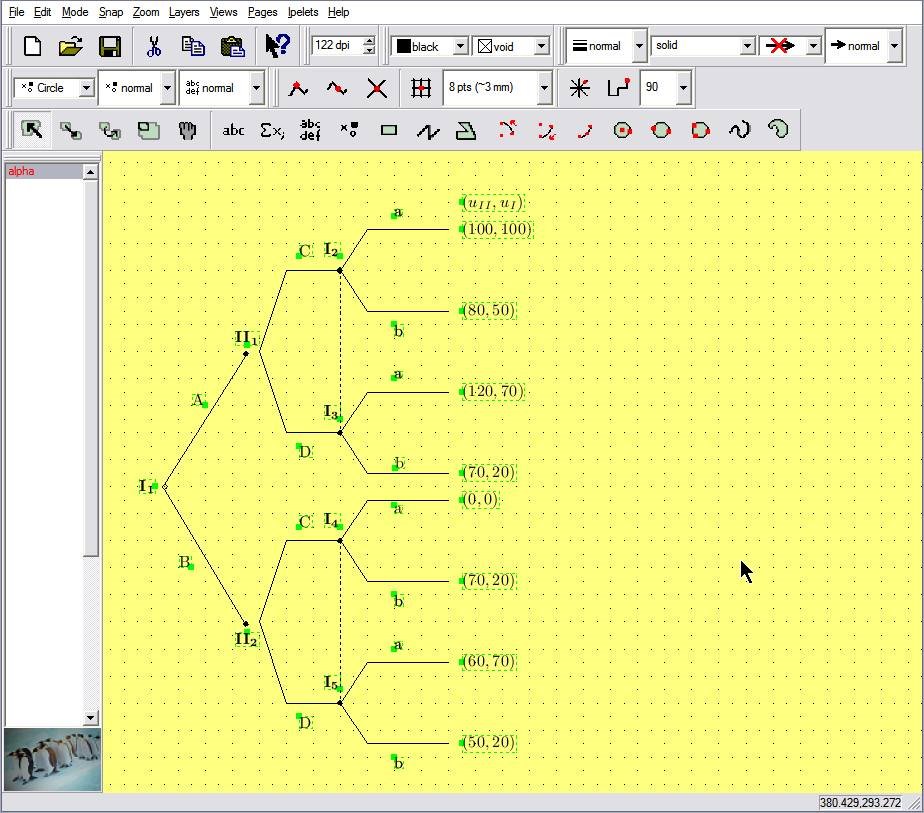
Ipe extensible drawing editor is a very nice tool for drawing figures for LaTeX. It is developed by Otfried Cheong. The source code and the binaries for Windows and Linux can be downloaded from ipe.compgeom.org.
The features of ipe are (from the web site):
* Entry of text as LaTeX source code. This makes it easy to enter mathematical expressions, and to reuse the LaTeX-macros of the main document. In the display text is displayed as it will appear in the figure.
* Produces pure Postscript/PDF, including the text. Ipe converts the LaTeX-source to PDF or Postscript when the file is saved.
* It is easy to align objects with respect to each other (for instance, to place a point on the intersection of two lines, or to draw a circle through three given points) using various snapping modes.
* Users can provide Ipelets (Ipe plug-ins) to add functionality to Ipe. This way, Ipe can be extended for each task at hand.
* The text model is based on Unicode, and has been tested with Korean, Chinese, and Japanese.
* The UI is implemented using the portable toolkit Qt, and so can be compiled for Unix, Windows, and Mac OS X (see below).
It can save its figures in the EPS (encapsulated Postscript) format for using with dvips or in the PDF format for using with pdflatex.
Ipe is not very simple to use since it has some special tricks (for example the transition between different modes can be cumbersome sometime), but it is very powerful for drawing even complex figures for LaTeX and it is now my main drawing software.
Subscribe to:
Posts (Atom)